Flow Traces
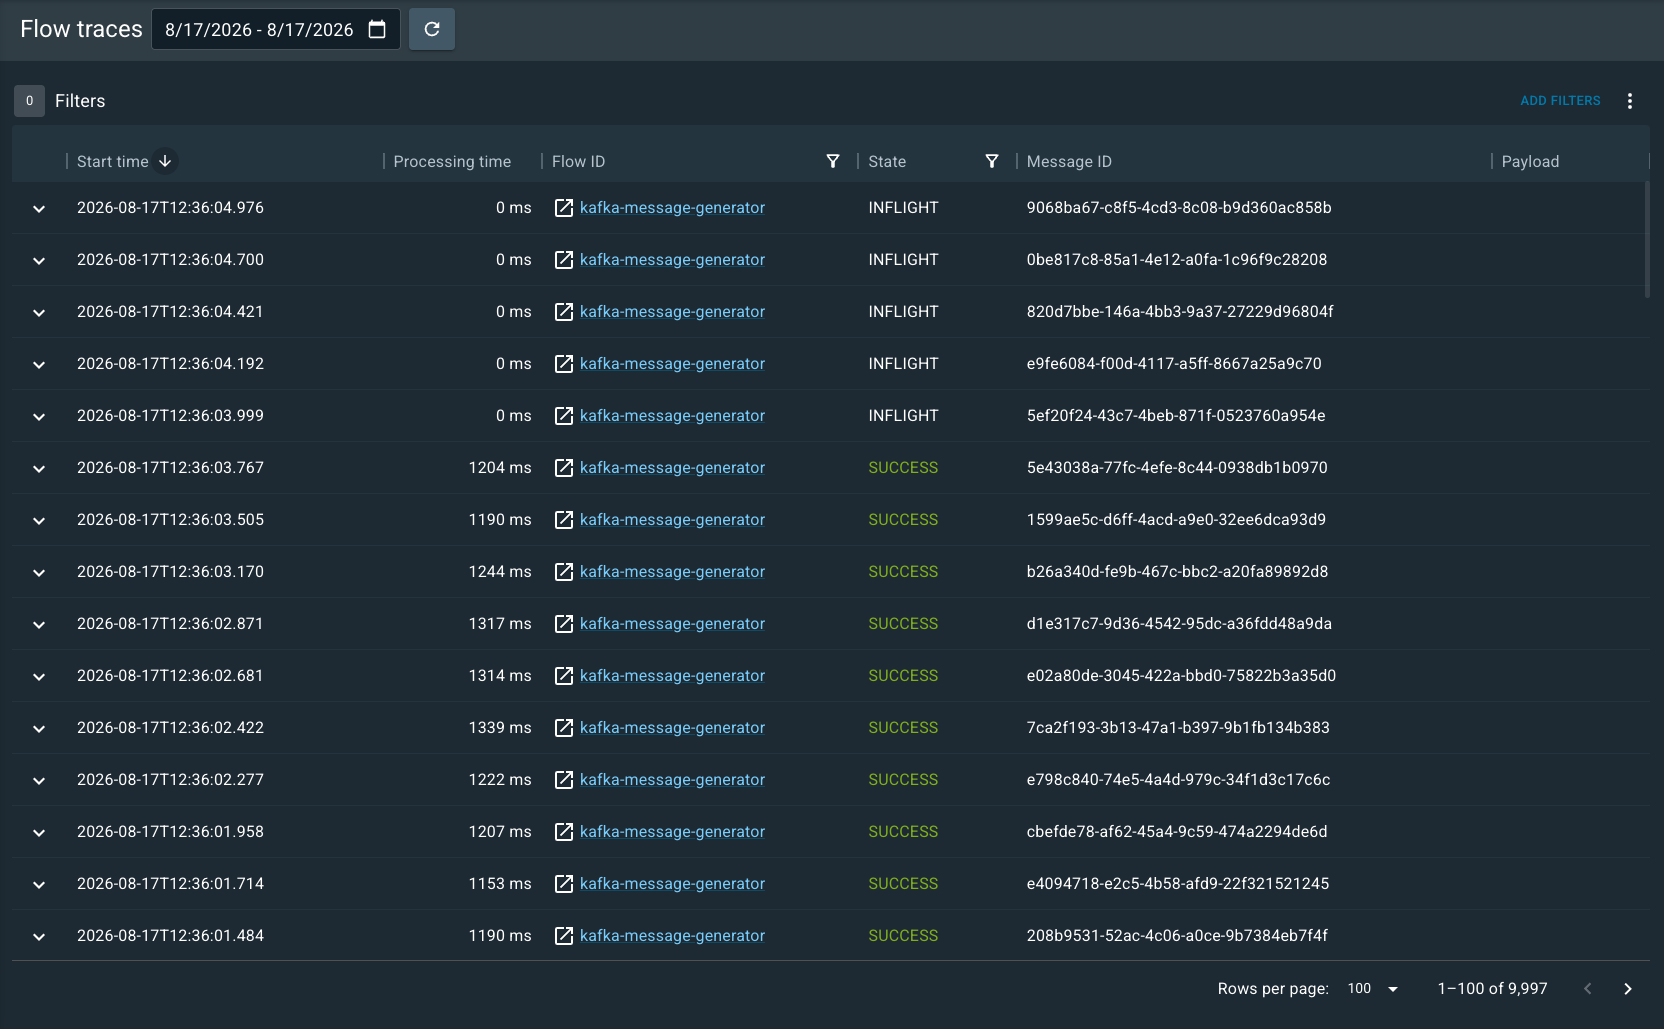
Use Flow Traces to view all messages processed across flows in the selected time range. On the Overview page, you can see in-flight, complete, failed, and total message counts for all flows. To view processed messages, select Flow traces in the left navigation menu. The following image shows Flow Traces with the default time range and without any filters selected:
Filter Traces
Open the Flow Traces page by selecting a message count button, either from the Overview page or from an individual flow page. For example, the message count in the following image acts as a button to filter by failed messages:

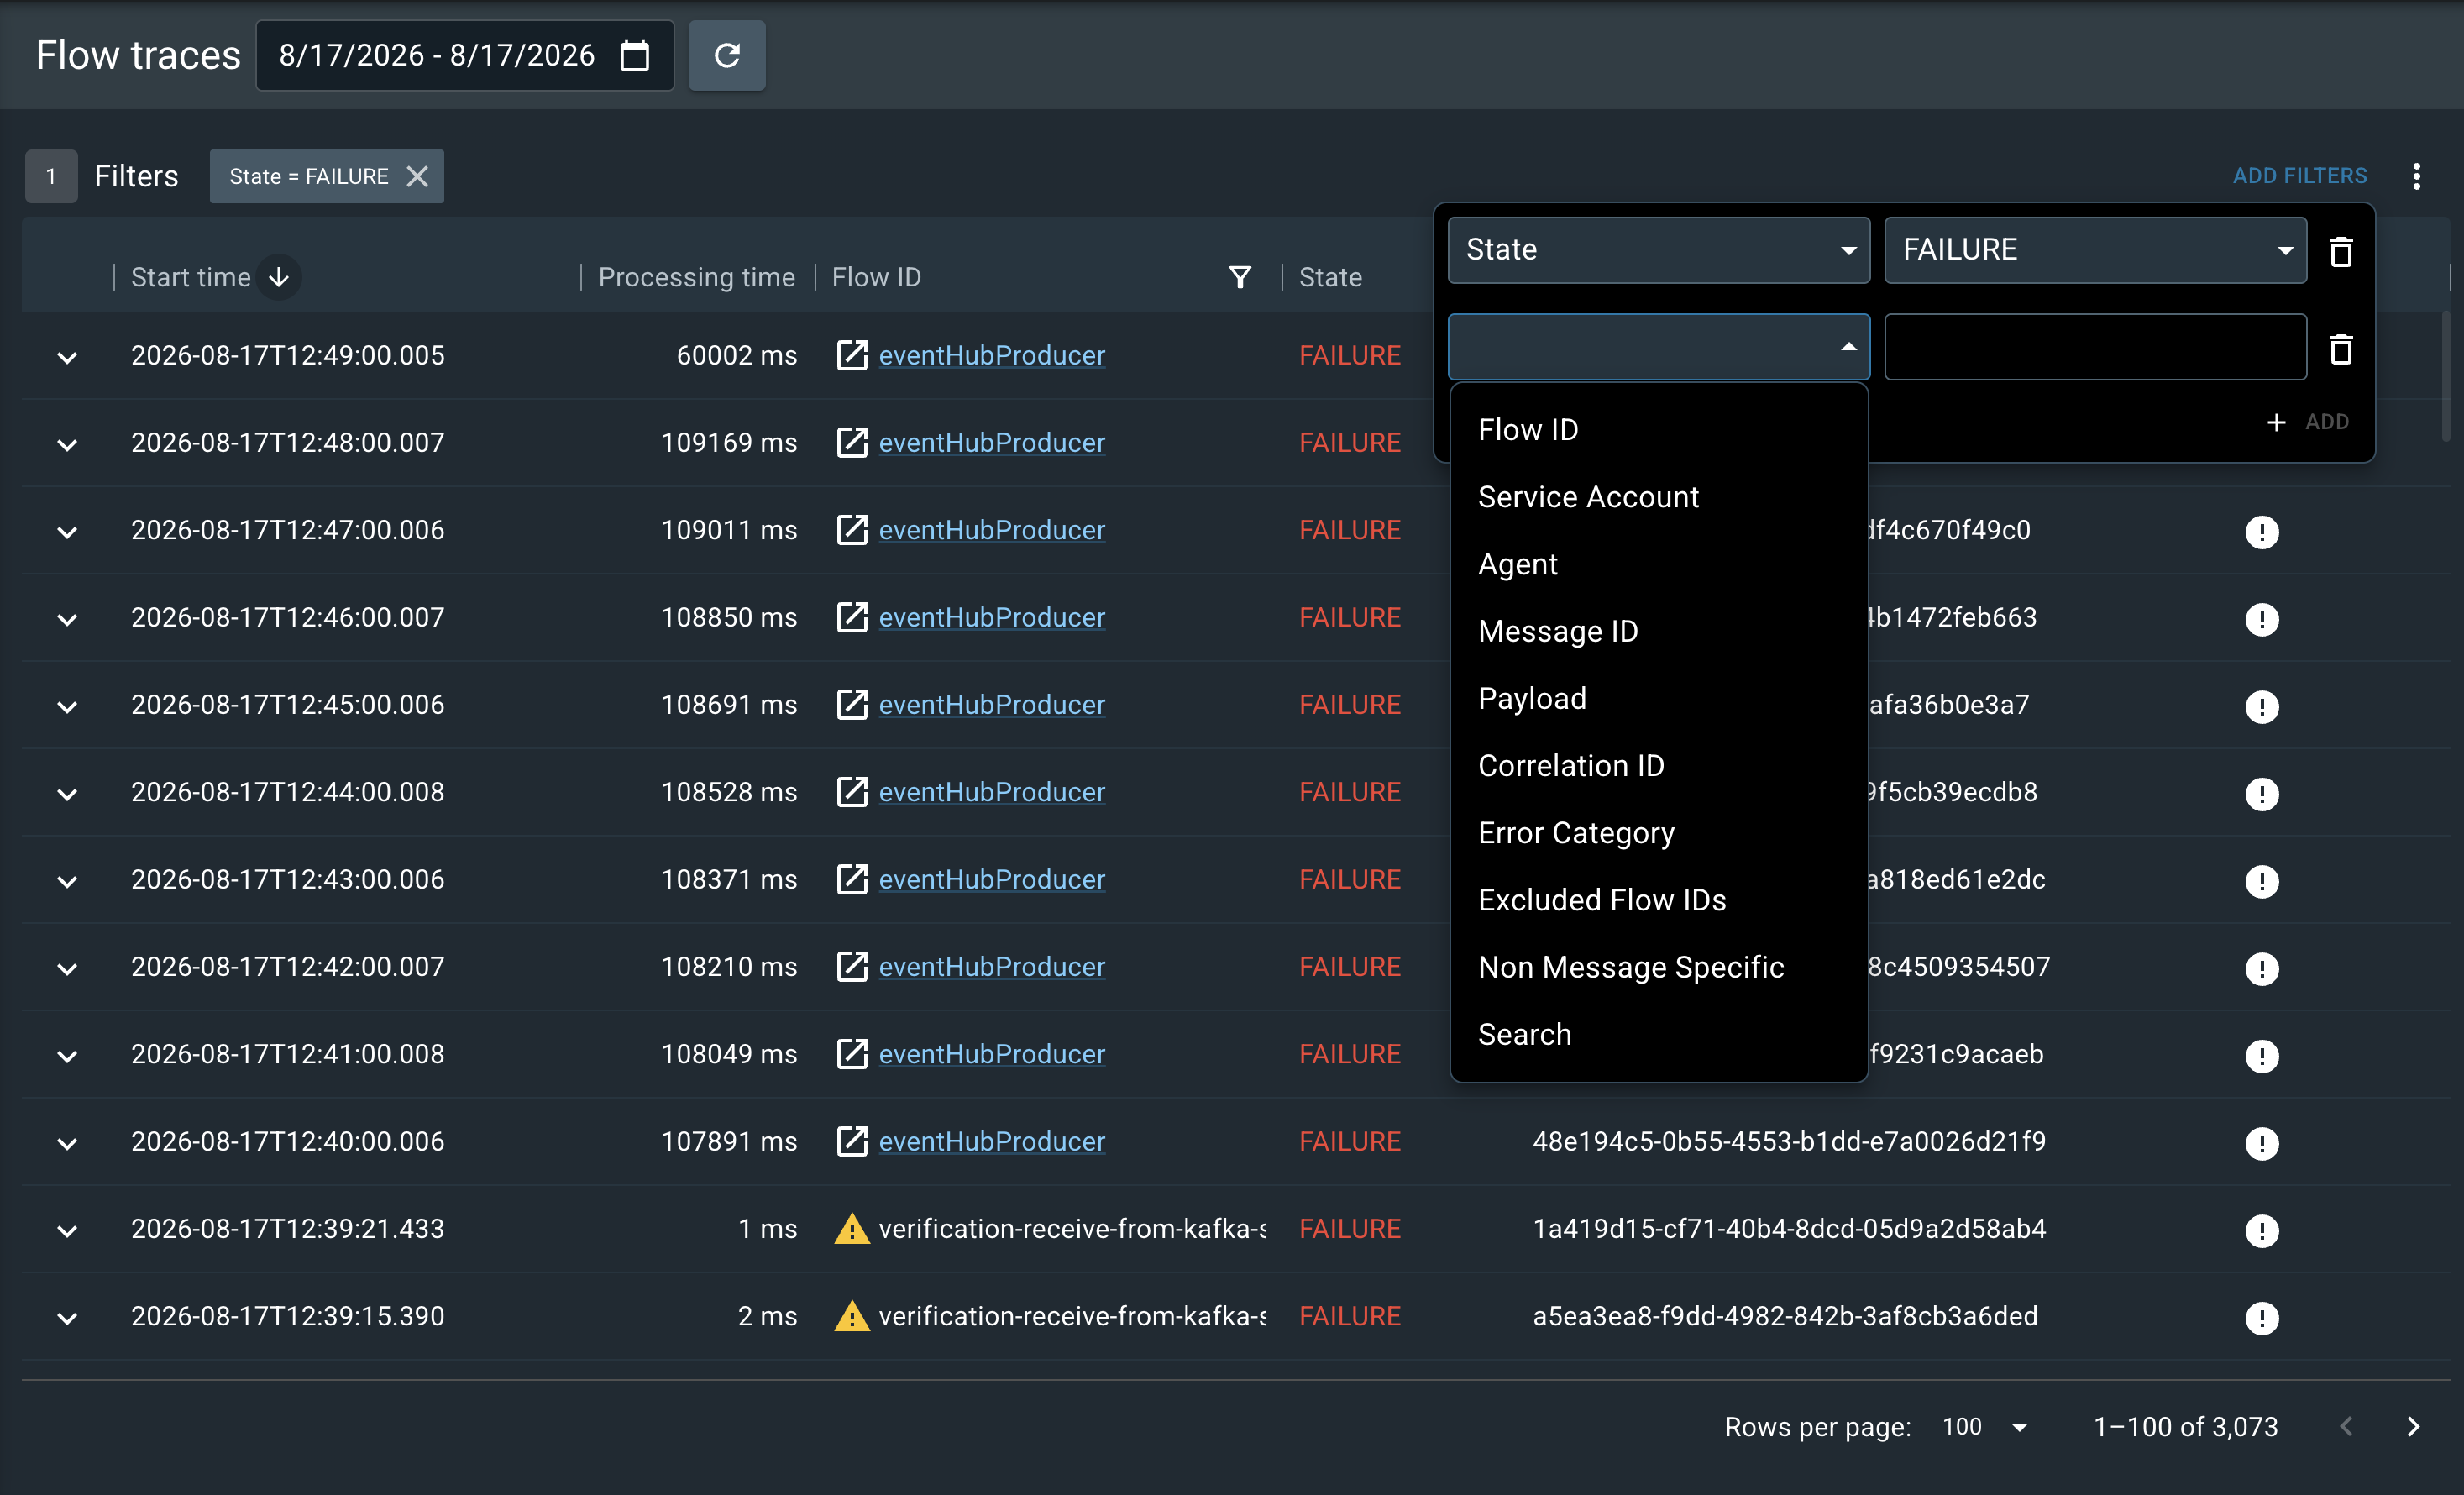
If you select this button on an individual flow page, the page also applies a filter for that flow ID. To add more filters, select Add Filters at the top-right of the page and choose the filter name in the dropdown and value to filter by. To remove a filter, select the ( ) icon next to the filter name. The following image shows Flow Traces with the filter "State = FAILURE" applied:
| The Beatbox filter is used to narrow the list down to flows on a specific Beatbox installation. If "Beatbox: Cloud" is selected, however, then all Beatbox flow traces are excluded. You can also double-click the name of the Beatbox in the filter to search by ID instead. |
The Overview page displays errors that a source processor reports outside of message processing in a warning dialog. For details, see Identify Connector Errors.
Download Traces
You can download filtered flow traces as a CSV file. Select the vertical ellipsis ( ⋮ ) button, select Download Traces, then select Download in the dialog box to download the CSV file.

The CSV file includes the following values, regardless of which columns appear on the page:
START_TIME;END_TIME;PROCESSING_TIME;ORIGIN;FLOW_ID;FLOW_NAME;STATE;PRINCIPAL;MESSAGE_SIZE;MESSAGE_ID;CORRELATION_ID;ERROR_CATEGORIES
The column "PRINCIPAL" in the CSV file is the same as "Service account" in Utilihive Heartbeat.
Inspect Failed Messages
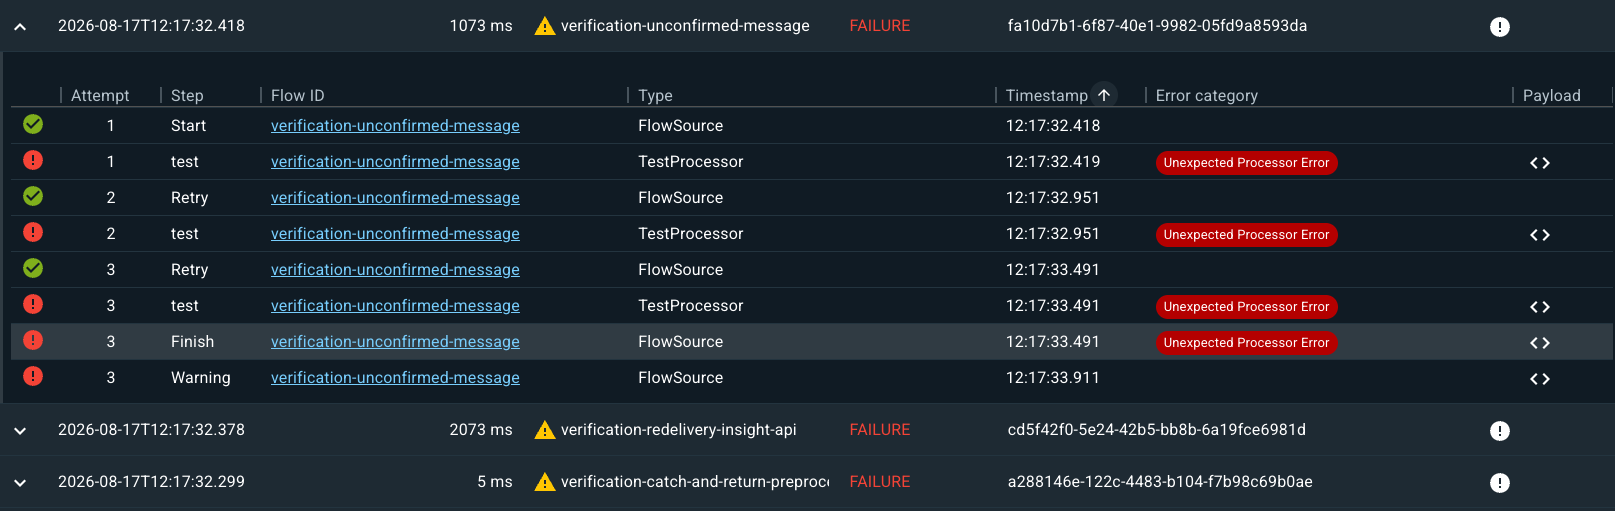
Expand a message in the flow traces list to view the number of delivery attempts. Select a delivery attempt to view the sequence of events and processors the message passed through. The following image shows the flow trace for a failed message:
Selecting either the folder button (  ) or error button (
 ) displays the error messages in the payload. The following image shows the payload for a failed
restRequest processor:

In this case, the processor attempted to make a POST request to another endpoint but received a 403 status. For reference, the error message appears in the following text:
Processing of ba47589f-38f2-4bc1-aed2-baa3ff776174 failed, reason: verification-rest-request-transience-override > restRequest: Unsuccessful status 403 for message ba47589f-38f2-4bc1-aed2-baa3ff776174 URL 'http://connect-resourceregistry/path-that-will-cause-403' HTTP Method 'GET' Authorization 'anonymous' Body: RBAC: access denied. Cause: null. Transience: transient.
Identify Connector Errors
The Utilihive Console reports errors from a flow’s source processor separately from message failures. Use these connector errors to identify connectivity, authorization, and initialization issues, even when the flow processes no messages.
A non-message-specific error occurs in a source processor outside the processing of any individual message. The Console calls these errors connector errors. Because no message is involved, the error has no message payload and no delivery attempts.
Connector errors typically result from one of the following causes:
-
Connectivity: The connector loses its connection to the external system, for example when a Kafka broker is unavailable or a poller loses its connection to an external queue.
-
Authorization: The connector is not permitted to perform an action, for example an Azure Event Hubs source that lacks the Azure RBAC role required to receive events.
-
Initialization: The source endpoint fails to start, for example because of an invalid connection setting or missing permissions.
Connectors that retry failed connections typically report only the non-message-specific error and do not switch the flow to a failed state. So the flow can appear healthy while the source processor receives no messages.
A failure while processing a message, such as a failed restRequest processor, is a message failure, not a connector error.
For more information, see Inspect Failed Messages.
|
Find Connector Errors on the Overview Page
The Console displays connector errors in a dedicated warning dialog on the Overview page, the first page that opens after you sign in. The dialog is the primary place to find these errors. It is separate from the message counts and message traces because the errors are not related to messages.
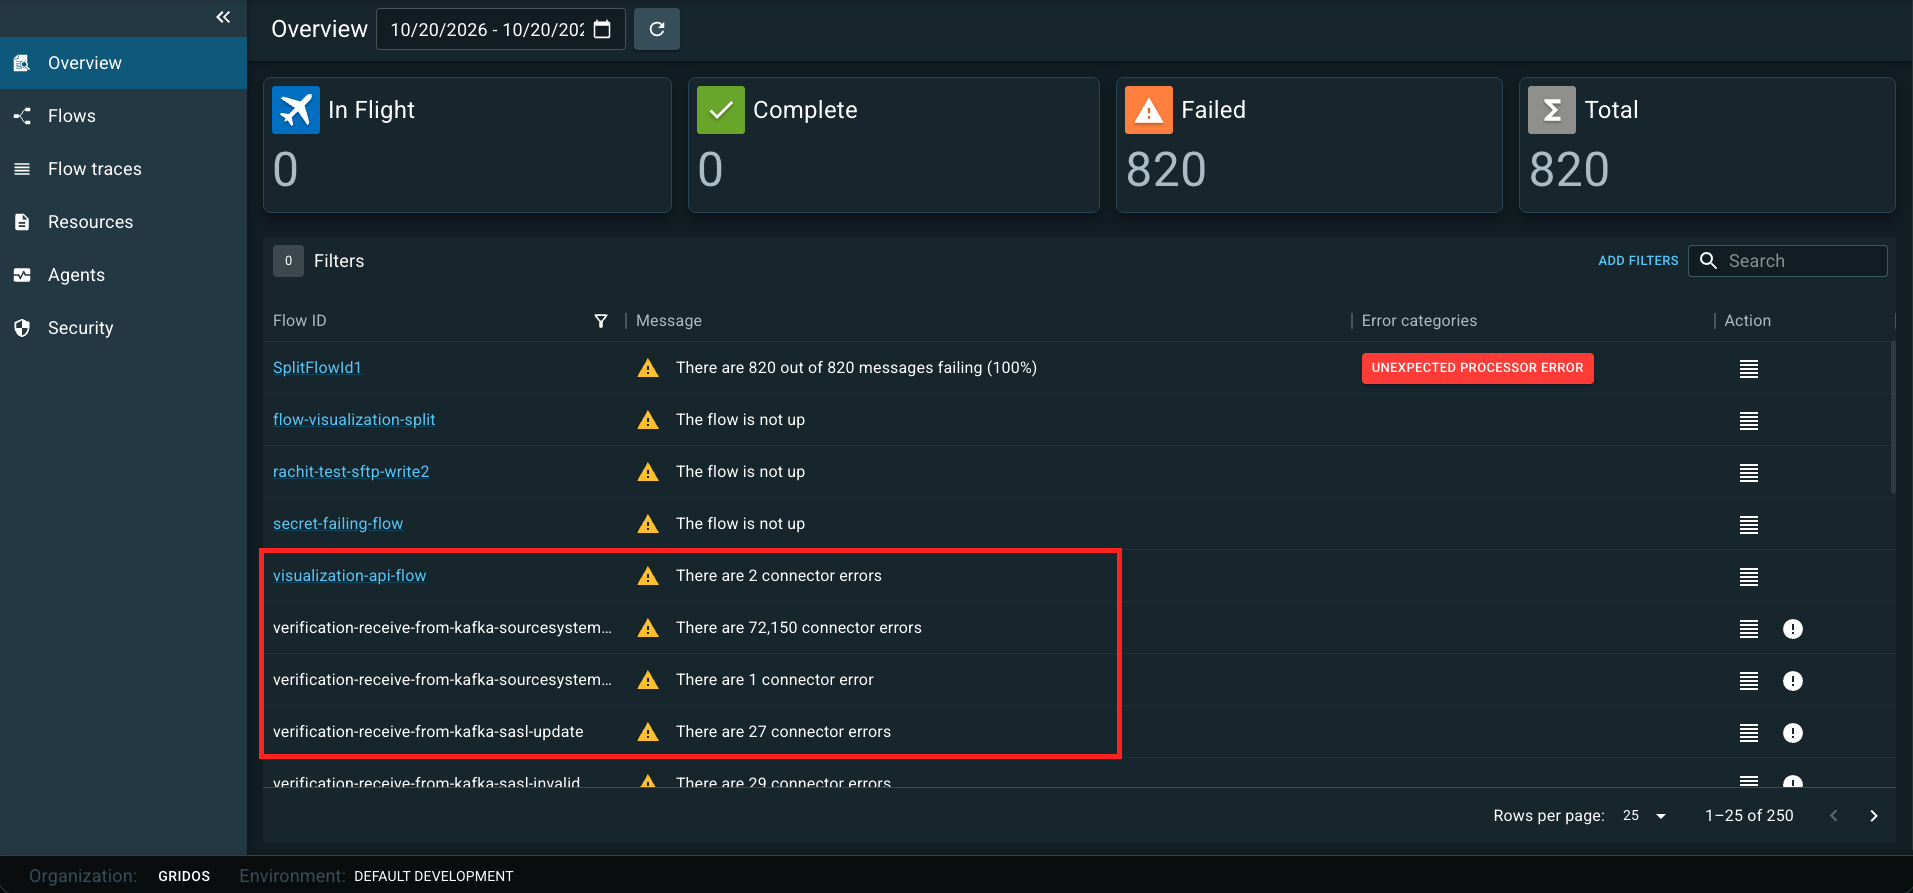
Use the warning to decide which flow and source processor to investigate.
To forward connector errors to a flow for custom handling, set forwardNonMessageRelatedErrors in the flow’s deadLetterStrategy.
For more information, see Dead Letter.
|
View Connector Errors in Flow Traces
| Connector errors are not message-related, so they are not intended to appear in message traces. The trace view described here reflects current behavior and may change. Use the warning dialog as the primary source. |
To view connector errors in Flow Traces:
-
Select Flow traces in the left navigation menu.
-
Select Add Filters at the top-right of the page.
-
Select the non-message-specific error filter and its value.
-
Optionally, add a flow ID filter to narrow the list to one flow.
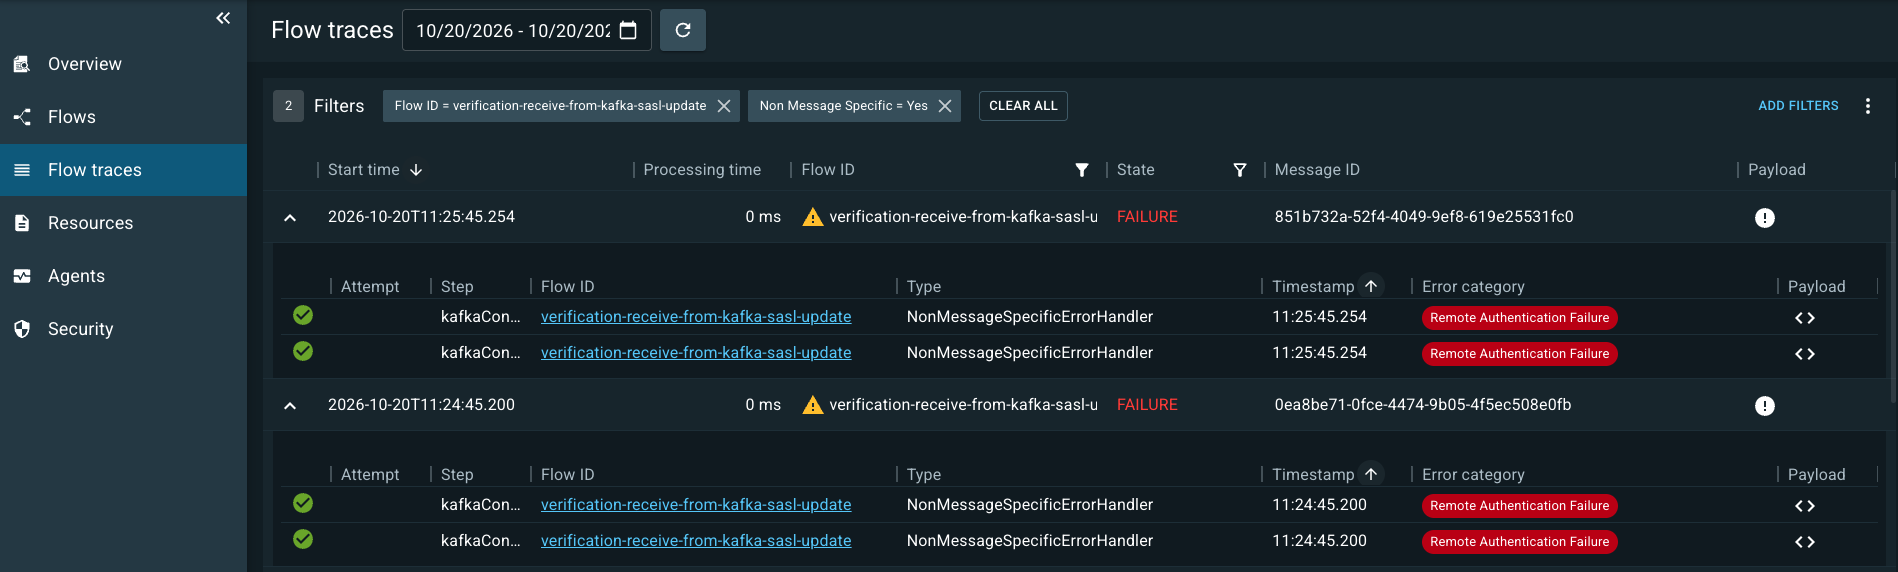
Expand a trace to read the error text returned by the connector. For example, a missing Azure RBAC role on an Event Hubs source produces an authorization error in the trace, while the flow state remains unchanged.
Resubmit Messages
If resubmitting traces is enabled for your organization, applicable flow traces include a resubmit button (  ) in the Payload column.
You can resubmit a message only when all of the following conditions are met:
-
The target flow is a handoff flow (for example, not a REST-based source flow).
-
The flow has archived the payload of the source processor.
-
There is a separate
resubmitsflow that performs archive retrieval and forwards the message(s) to the resubmission flow. -
The predefined
insights-archive-userservice account is given access to theresubmitsflow and all downstream flows.
At minimum, you need four flows that work together to save or archive the payload, retrieve it, and resubmit it. The following diagram shows how these flows work together:

For technical implementation details, see Archive and Resubmission.
Batch Resubmits
To perform a batch resubmit, select the vertical ellipsis ( ⋮ ) button at the top of the page and select Resubmit payloads in list. Batch resubmits are available only when the flow trace list is filtered to a single flow ID and the Payload = Yes filter is applied. For example:

A batch resubmit is useful when a system has been down for several hours and failed messages have accumulated. Apply additional filters, such as "Service Account = <service account>" and "State = FAILURE", to narrow the batch resubmit to a specific set.
Enable Payload Retrieval and Resubmission
When payload archiving, retrieval, and resubmission are enabled, the Flow Traces UI lets users download and resubmit payloads with a single click for each trace in the results view.
Set Up Payload Archiving
Follow the documentation in Archive and Resubmission and complete the following steps:
-
Create a service account as described in Dedicated Service Account.
-
Provide flows for payload archiving as described in Archive Payloads.
-
Provide flows for payload retrieval as described in Retrieve Payloads.
-
Provide flows for payload resubmission as described in Resubmit Payloads.
Configure API Access for Flow Traces
Provide the following value override when installing the connect chart, where <owner-id> identifies the organization and <api-key> is the API key credential associated with the insights-archive-user service account:
insights:
  config:
    application.yml:
      archive:
        apiKeys:
          <owner-id>: <api-key>